Social Media Silent Scroller Traits: Instagram Insights vs Sprout Social and Other Tools for Understanding Passive Audiences

The best way to understand silent scrollers is to compare behavior signals, not chase comments. Passive audiences often watch Stories, replay Reels, save posts, tap links, visit profiles, or pause on content without ever liking or replying. Instagram Insights shows useful native signals, while Sprout Social and similar platforms help connect those signals across accounts, campaigns, and reporting periods.
TLDR: Silent scrollers are not inactive users; they are low-visibility users who consume content without public engagement. For example, an Instagram Reel with 42,000 plays, 310 likes, and 1,900 saves may be far more valuable than a post with 800 likes and almost no saves. Instagram Insights is enough for basic checks, but tools like Sprout Social, Hootsuite, Buffer, Later, Metricool, and Google Analytics help show patterns across time. The strongest analysis combines reach, watch time, saves, profile visits, link clicks, and conversion data.
What Silent Scrollers Usually Look Like
Silent scrollers are the people who see your content but rarely make themselves visible. They do not comment. They may not like. They may never send a DM. Still, they can be serious prospects, loyal readers, future buyers, job applicants, donors, or silent fans.
Their traits usually appear in patterns rather than names. You will not see a clean list of “lurkers.” Privacy rules prevent that, and rightly so. What you can measure is behavior.
- High impressions with low engagement: Many people see the post, but few react publicly.
- Strong Story completion: Users watch through multiple frames without replying.
- Above-average saves: The content has private value.
- Profile visits after posts: People check who you are before acting.
- Link clicks without comments: The audience is interested but quiet.
- Repeat reach: The same broad audience keeps returning over time.
Do not confuse silence with weakness. In many sectors, especially finance, health, B2B, education, and legal services, users avoid public reactions because the topic feels personal or professional.

Instagram Insights: Good for Native Behavior, Weak for Deeper Context
Instagram Insights is the first stop because it uses native platform data. It shows reach, impressions, profile activity, content interactions, follower growth, Story activity, Reel plays, and audience demographics. For creators and small teams, this can be enough to spot silent interest.
The strongest Instagram Insights metrics for passive audiences include:
- Reach: How many unique accounts saw the content.
- Impressions: How often content was displayed.
- Saves: A strong private intent signal.
- Shares: Often more meaningful than likes.
- Profile visits: A sign of curiosity or consideration.
- Website taps: A clear step toward off-platform action.
- Story exits: A warning that content may be losing attention.
- Reel watch behavior: Useful for judging content retention.
The catch is that Instagram Insights can feel cramped when you need serious analysis. Comparing 12 posts across three months takes longer than it should. Export options are limited. Historical access can be restrictive depending on account setup and reporting needs. If you manage one account, fine. If you manage six, expect friction.
Instagram also tells you what happened inside Instagram. It does not fully explain what users did after clicking your bio link, opening your shop, reading your blog, or signing up for a webinar. That gap matters.
Sprout Social: Better for Reporting, Teams, and Cross-Channel Signals
Sprout Social is stronger when the question changes from “How did this post perform?” to “What does this audience keep doing across channels?” It brings social profiles into one reporting system and gives teams a cleaner way to compare content, tags, campaigns, timing, and audience response.
For silent scroller analysis, Sprout Social is useful because it helps group content by theme. You can tag posts as educational, product, founder content, case study, or trend response. Then you can compare which type earns saves, clicks, reach, or quiet traffic.
That matters because passive audiences often show preference through repetition. They may ignore flashy posts but consistently save pricing explainers. They may never comment on customer stories but click every hiring post. Sprout makes these patterns easier to see.
It also improves stakeholder reporting. A marketing manager can show that a campaign had weak comments but strong intent: 18% higher profile visits, 27% more link clicks, and a 14% lift in saved content compared with the prior month. That is much harder to explain with screenshots from Instagram Insights.
Honestly, it feels like native reports force teams to defend quiet success too often. A post with few likes can still move serious users. Sprout helps make that case with cleaner comparisons.

Other Tools Worth Considering
Sprout Social is not the only option. The right tool depends on budget, channel mix, team size, and how much reporting detail you need.
- Hootsuite: Good for scheduling and multi-network management. Reporting is useful, though deeper analysis may require higher plans.
- Buffer: Simple and clean. Better for small teams that want basic performance metrics without heavy workflow features.
- Later: Strong for visual planning, Instagram scheduling, and creator-style workflows. Useful for spotting content format trends.
- Metricool: Practical for cross-platform reports, competitor checks, and paid plus organic views in one place.
- Google Analytics 4: Critical for seeing what silent users do after they leave Instagram.
- Looker Studio: Helpful for combining social data, web traffic, CRM activity, and campaign results into one report.
The best setup often pairs a social tool with web analytics. Instagram can tell you that 620 people tapped the link. Google Analytics can show that 148 stayed longer than one minute, 39 viewed pricing, and 11 submitted a form. That is the difference between attention and business value.
Metrics That Reveal Passive Audience Intent
Likes are easy to understand, but they are a weak signal on their own. Silent scrollers often avoid public reactions, so you need private and behavioral metrics.
- Save rate: Saves divided by reach. Strong for educational and reference content.
- Share rate: Shares divided by reach. Good for relevance and trust.
- Profile visit rate: Profile visits divided by reach. Useful for brand curiosity.
- Click-through rate: Link clicks divided by reach or impressions. Good for action intent.
- Story completion rate: Viewers who reach the final Story frame. Strong for attention.
- Reel retention: How long people keep watching. Better than raw plays.
- Returning visitor traffic: A sign that quiet users are coming back.
A serious report should separate public engagement from private intent. Public engagement includes likes, comments, and visible shares. Private intent includes saves, click behavior, repeat views, profile visits, and conversions. Both matter, but they mean different things.
A Short Example: The Quiet Audience That Bought Later
Consider a small online education brand with 24,000 Instagram followers. Over 30 days, its carousel posts averaged only 96 likes and 4 comments. At first glance, performance looked modest.
But the passive signals told another story. One exam checklist carousel reached 18,400 accounts, earned 1,260 saves, drove 430 profile visits, and produced 170 website taps. Google Analytics showed 62 course page visits from that post’s UTM link. Nine users purchased within seven days.
The comment section looked sleepy. The revenue did not.
This is why silent scroller analysis matters. People often make decisions privately before they act publicly, if they ever act publicly at all.
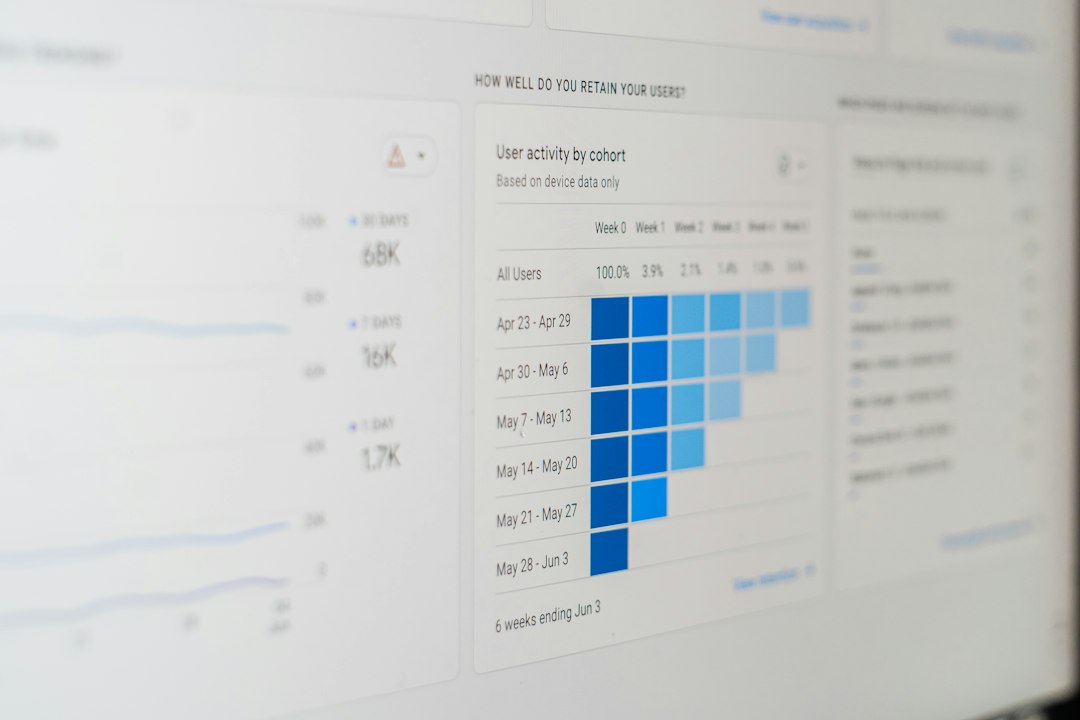
Instagram Insights vs Sprout Social: Practical Verdict
Use Instagram Insights when you need a quick read on individual posts, Stories, Reels, audience demographics, and native account activity. It is free, direct, and accurate for Instagram-only checks.
Use Sprout Social when you need campaign reporting, team workflows, content tagging, multi-account comparisons, and clearer trend analysis. It is better for proving value to clients, executives, or larger marketing teams.
Use Google Analytics with either option when silent scrollers are expected to take action on a website. Without off-platform data, you are guessing at commercial impact.
How to Study Silent Scrollers Without Overclaiming
Trustworthy analysis has limits. You cannot identify every passive user. You cannot assume every view means interest. You cannot treat impressions as loyalty. Good reporting avoids inflated claims.
Use a simple framework:
- Measure exposure: reach, impressions, views.
- Measure attention: watch time, Story completion, repeat views.
- Measure private intent: saves, shares, profile visits, link taps.
- Measure outcomes: signups, purchases, inquiries, downloads.
- Compare over time: weekly and monthly trends show more than one viral post.
Silent scrollers are easy to underestimate because they do not applaud in public. That does not make them passive in value. It only makes them harder to read. Instagram Insights gives the first clues. Sprout Social and other analytics tools help turn those clues into evidence.
The smartest approach is calm and practical: track quiet signals, connect them to real outcomes, and stop treating comments as the only proof that people care.